Plots
metafopy draws plots with matplotlib. Each plot function draws on the current axes (or on an axes object passed as ax=)
and returns a result object that holds what was plotted. Save and show figures with the usual matplotlib functions.
The plot gallery reproduces the plots of the metafor documentation with metafopy, and compares them with the R figures.
import matplotlib

matplotlib.use('Agg')

import matplotlib.pyplot
import numpy

from metafopy import datasets, escalc, rma

dat = escalc(measure='RR', ai='tpos', bi='tneg', ci='cpos', di='cneg', data=datasets.load('dat.bcg'))
dat['label'] = dat['author'] + ', ' + dat['year'].astype(str)
res = rma('yi', 'vi', data=dat, slab=dat['label'])
Forest plot
from metafopy import forest

forest(res, atransf=numpy.exp, header=True)
matplotlib.pyplot.savefig('forest.png', dpi=150)
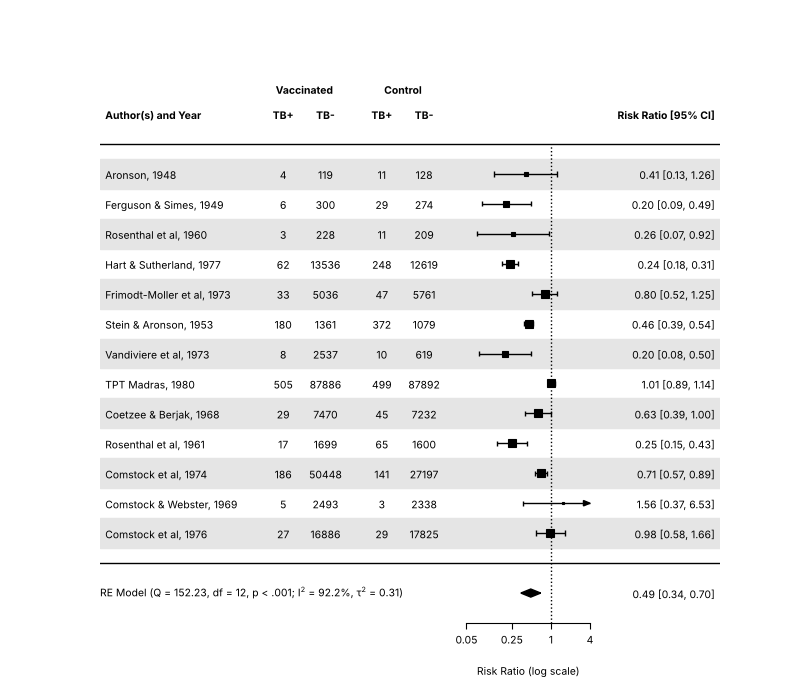
atransf transforms the axis labels (here to risk ratios) while the plot stays on the log scale, and transf transforms the
estimates themselves. Other common arguments are:
order:'obs'sorts by effect size,'prec'by precision, or give your own values.ilab,ilab_lab,ilab_xpos: columns of study information shown next to the plot.addpred=True: add the prediction interval to the summary.showweights=True: show the weights.xlim,alim,at,refline,xlab,digits,slab.na_action='pass': keep the studies dropped for missing values as (empty) rows of the plot, as metafor does underoptions(na.action='na.pass').
For plots with subgroups, draw the studies with forest(..., rows=...) and the summaries with addpoly. Examples are in the
metafor documentation: https://www.metafor-project.org/doku.php/plots:forest_plot_with_subgroups. The gallery also
reproduces the BMJ, RevMan and superscript styles.
from metafopy import forest

forest(res, atransf=numpy.exp, order='obs', addpred=True, xlab='Risk ratio')
matplotlib.pyplot.savefig('forest-sorted.png')
Funnel plot
from metafopy import funnel

matplotlib.pyplot.figure()
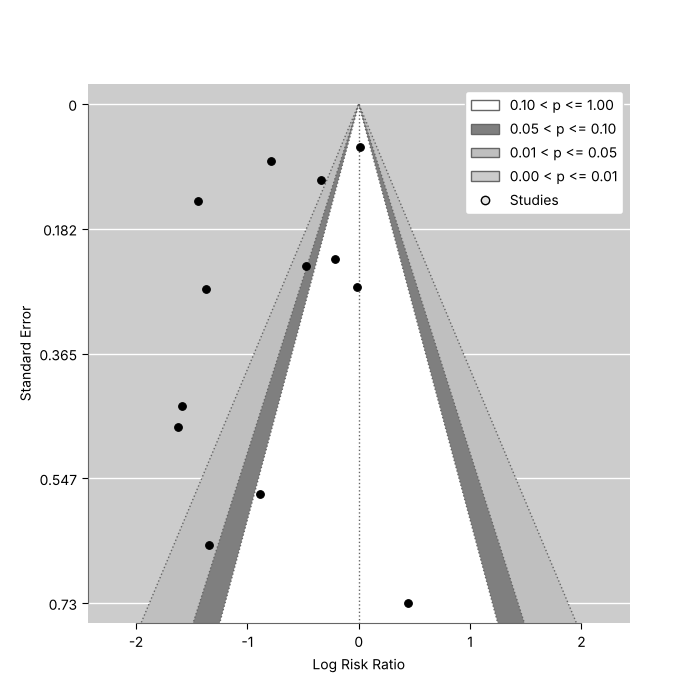
funnel(res)
matplotlib.pyplot.savefig('funnel.png')
yaxis sets the vertical axis ('sei' is the default, also 'vi', 'seinv', 'vinv', 'ni', 'ninv', 'sqrtni',
'sqrtninv', 'lni', 'wi'), level and shade draw the contours of statistical significance (contour-enhanced funnel
plots, Peters et al., 2008, https://doi.org/10.1016/j.jclinepi.2007.11.010), and funnel(trimfill(res)) shows the filled
studies.
matplotlib.pyplot.figure()
funnel(res, level=[90, 95, 99], shade=['white', 'gray55', 'gray75'], refline=0)
matplotlib.pyplot.savefig('funnel-contours.png')
Other plots
| Function | Plot |
|---|---|
radial |
Radial (Galbraith) plot |
labbe |
L'Abbe plot of 2x2 table event rates |
baujat |
Baujat plot, which studies drive the heterogeneity |
qqnorm |
Normal quantile-quantile plot of the residuals, with a simulated envelope |
plot_infl |
Case deletion diagnostics, see Diagnostics |
plot_profile |
Profile likelihood of a variance component, from profile; given the list profile returns for rma_mv, location-scale and selection models it draws one panel per component |
plot_gosh |
GOSH plot |
regplot, points_regplot |
Meta-analytic scatterplot of a model with one moderator (rma_uni, location-scale, selmodel, rma_mv and rma_glmm fits), with the regression line, confidence band and sized points; points_regplot redraws the points and labels of the result |
forest_cumul, plot_cumul |
Forest plot and plot of the results of a cumul analysis (forest(cumul(res)) calls the first) |
llplot |
Log-likelihoods of the studies as a function of the effect (OR or generic) |
plot_permutest |
Permutation distributions of a permutest result |
plot_vif |
Simulated (G)VIFs of a vif(sim=True) result |
plot_selmodel |
Selection function of a selmodel fit |
from metafopy import baujat, qqnorm, radial

matplotlib.pyplot.figure()
radial(res)
matplotlib.pyplot.figure()
baujat(res)
matplotlib.pyplot.figure()
qqnorm(res)
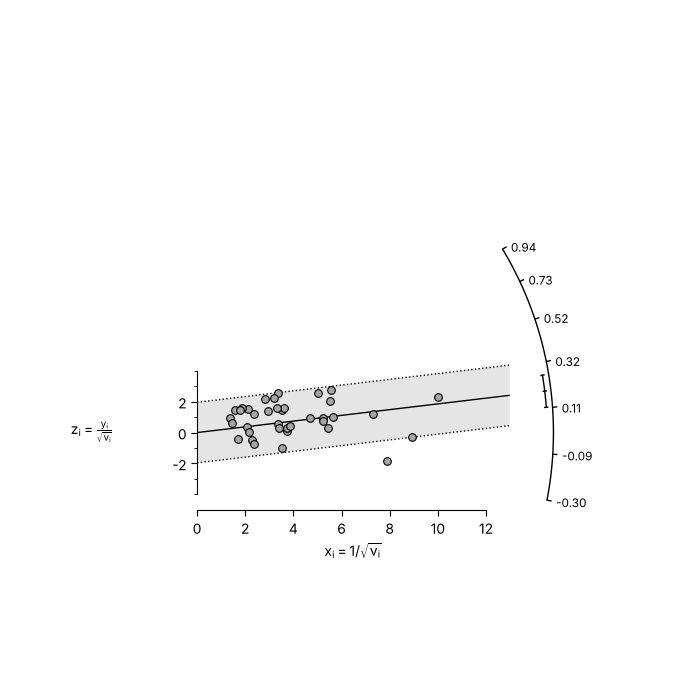
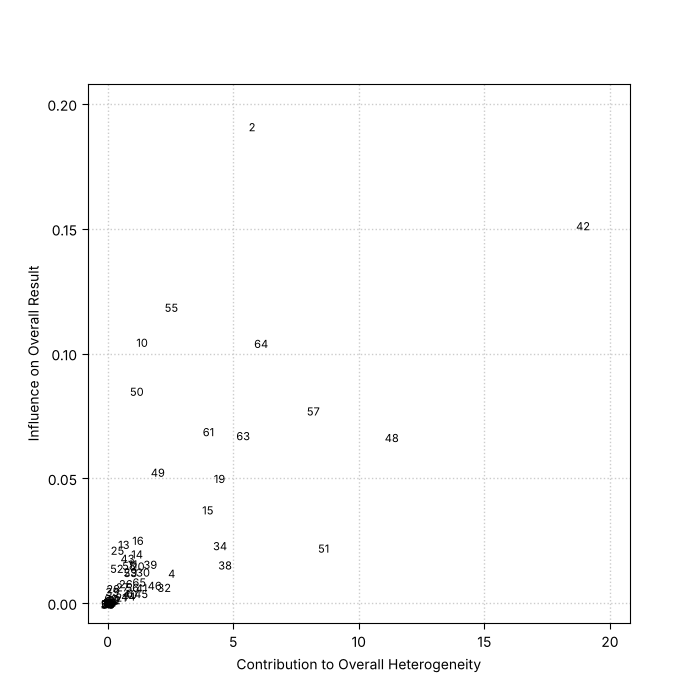
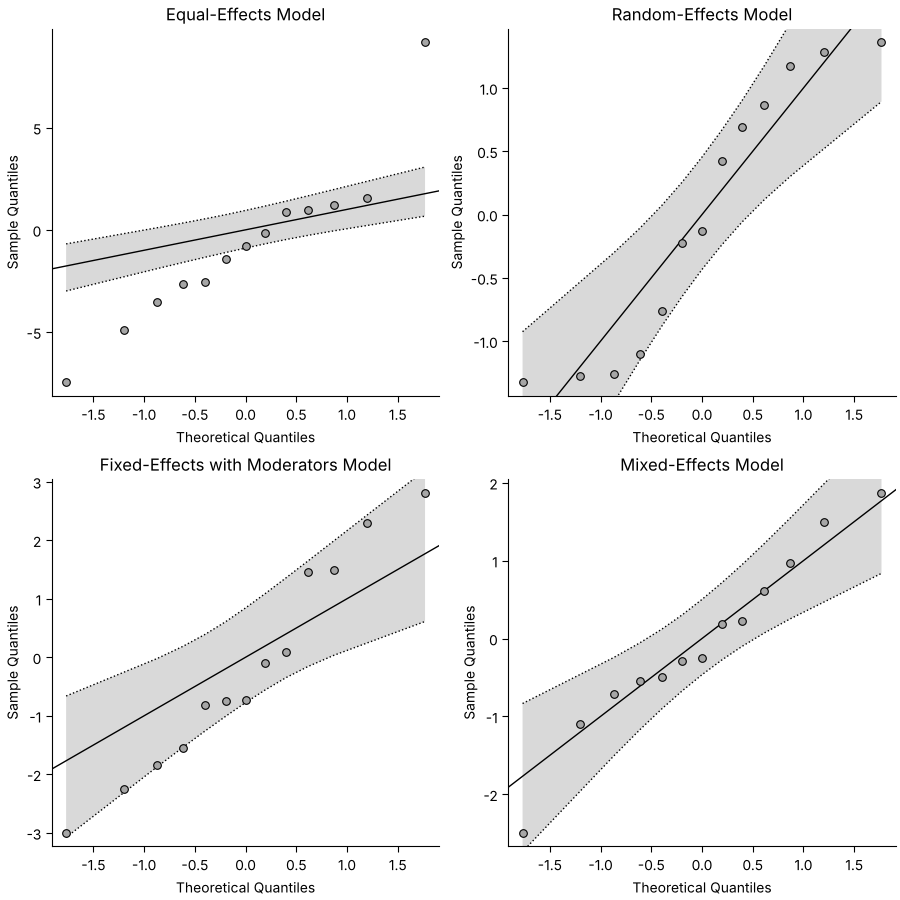
The gallery has more examples of each plot, and the plot of the influence diagnostics, the GOSH plot and the L'Abbe plot.
Interactive charts
metafopy.interactive builds the forest and funnel plots as interactive Altair (Vega-Lite) charts, for notebooks, the
web and reports. It needs the interactive extra (see Install) and is not loaded by import metafopy.
Hovering a study shows its estimate, interval and weight, and clicking a study highlights it. Both functions take an intercept-only fit and return a chart.
import metafopy.interactive

forest_chart = metafopy.interactive.forest_chart(res, transf=numpy.exp, refline=1.0, xlab='Risk ratio')
funnel_chart = metafopy.interactive.funnel_chart(res)
forest_chart.save('forest.html')
funnel_chart.save('funnel.html')
| Function | Chart |
|---|---|
forest_chart |
Row per study with a square sized by weight, then the pooled estimate as a diamond with its prediction interval; groups and group_fits add a pooled row per subgroup, and href links each study |
funnel_chart |
Funnel plot with the pseudo-confidence region; a trimfill result draws the imputed studies as open circles |
chart_data |
The frames behind both charts, as a ChartData, to inspect or build on |
The charts inline their data and use fixed colours, so they look the same wherever they are embedded. The showcase notebook links them to other charts.
Styling
Fonts and sizes are matplotlib's. fonts takes the family names metafor uses ('sans', 'serif', 'mono'), and cex,
cex_lab, cex_axis scale the text as in R. For anything else, pass your own ax= and use matplotlib on it.