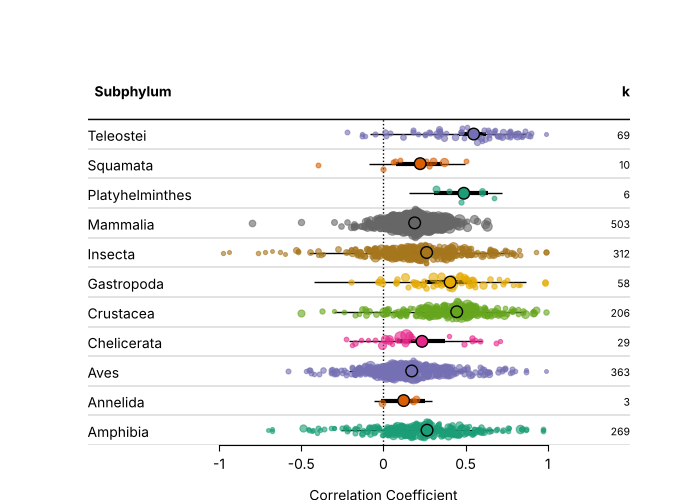
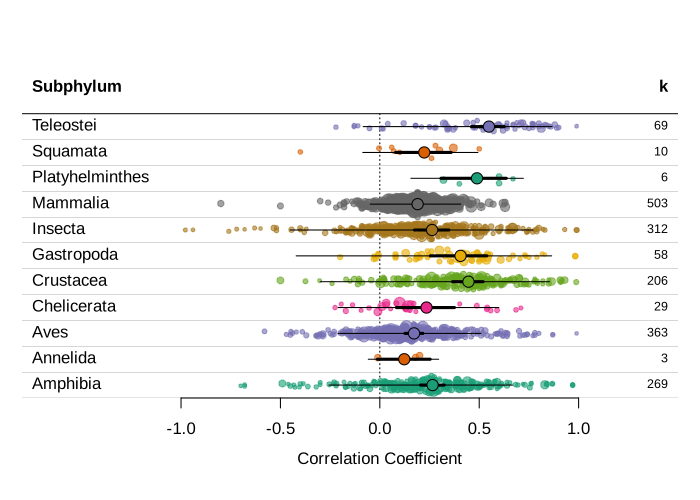
Plots compared with metafor
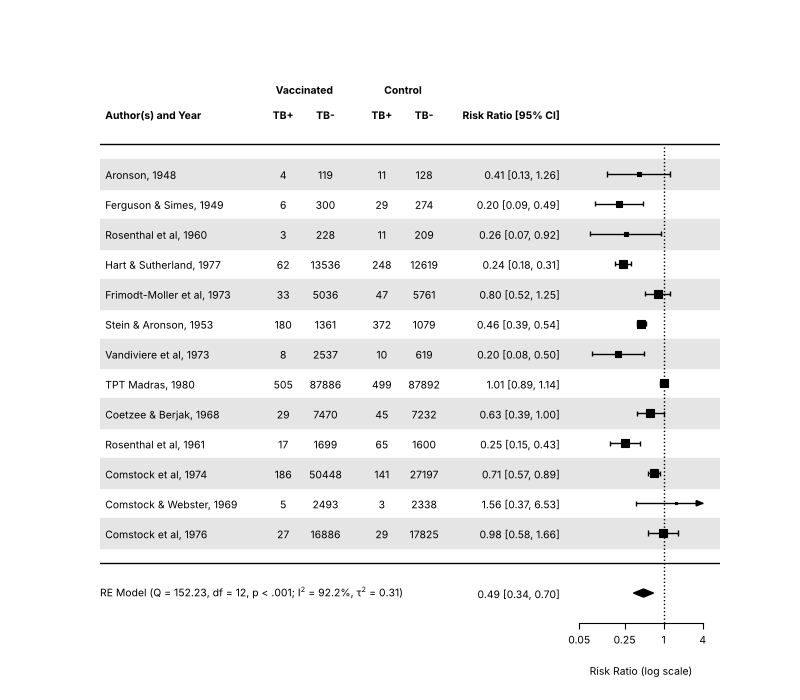
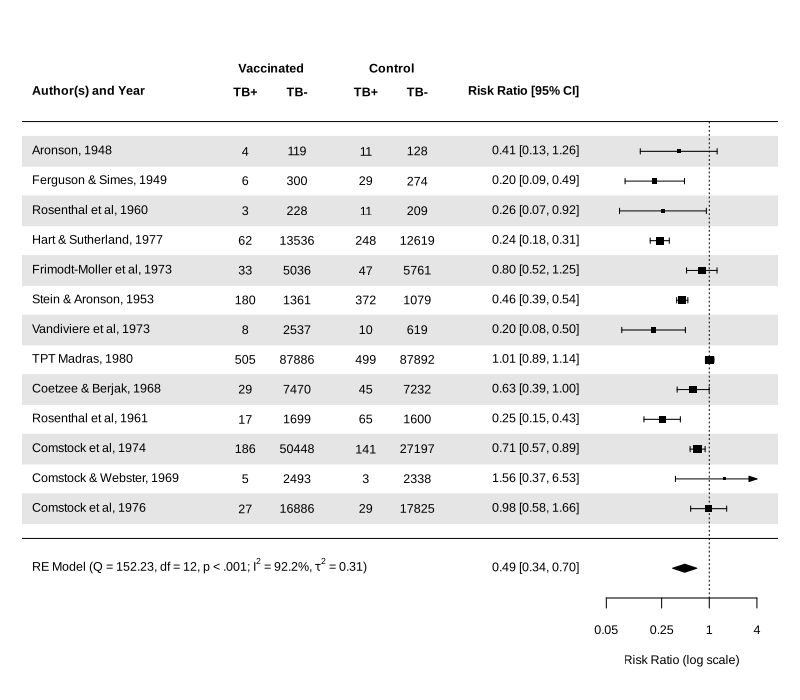
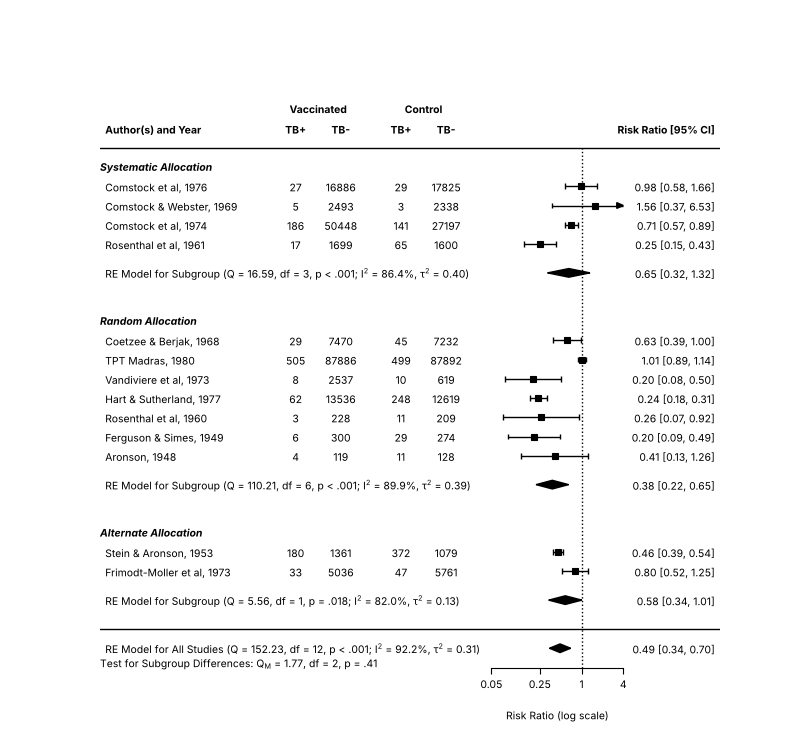
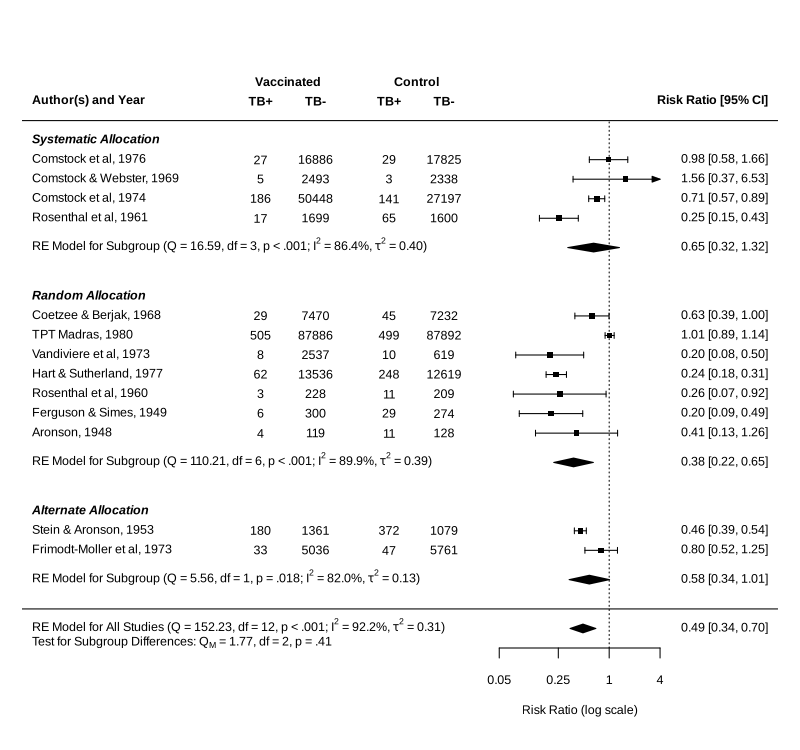
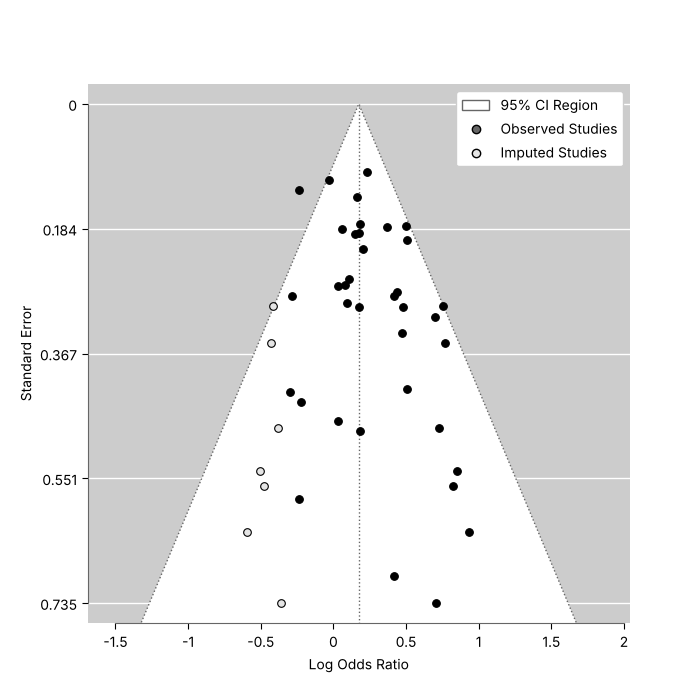
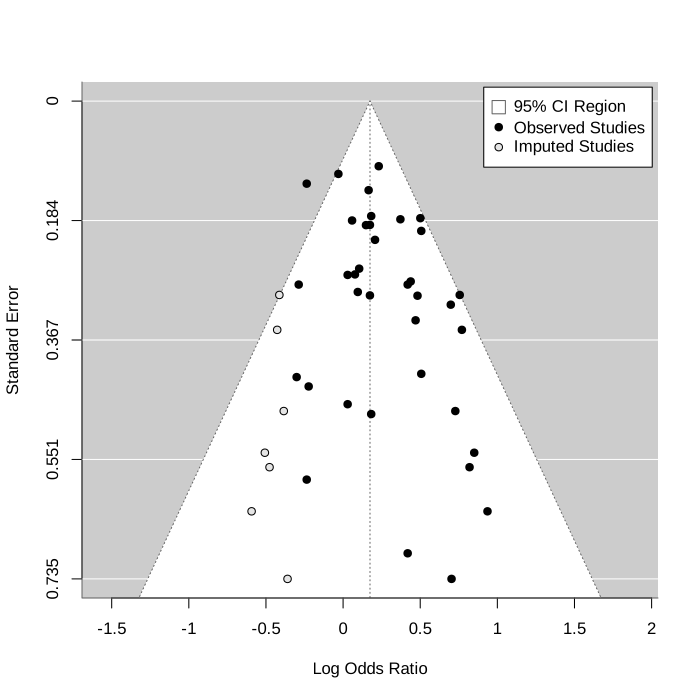
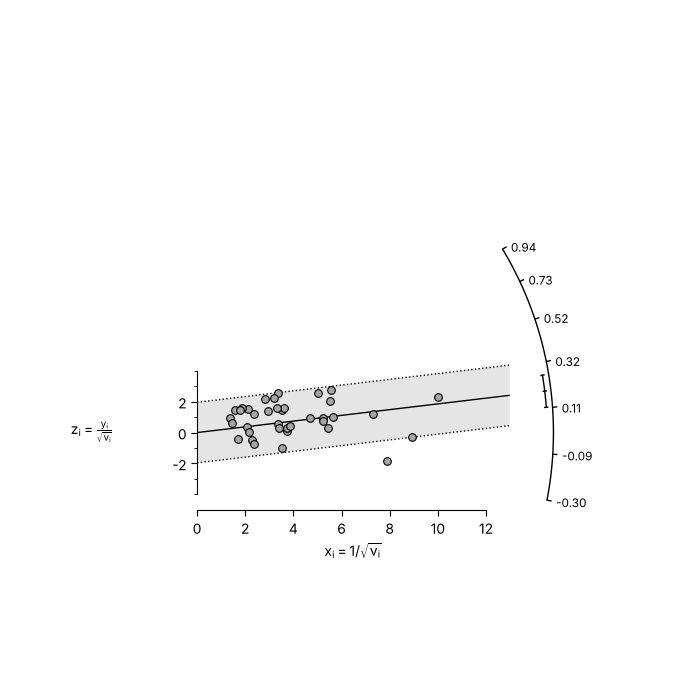
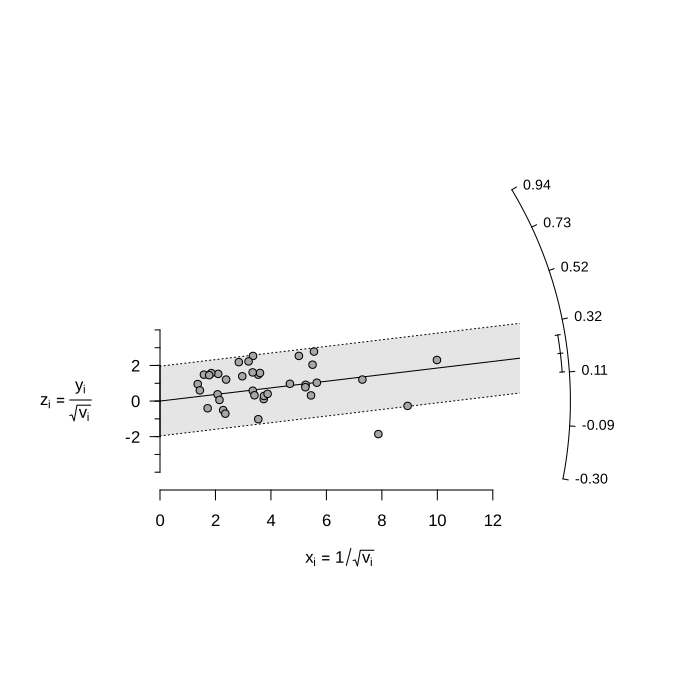
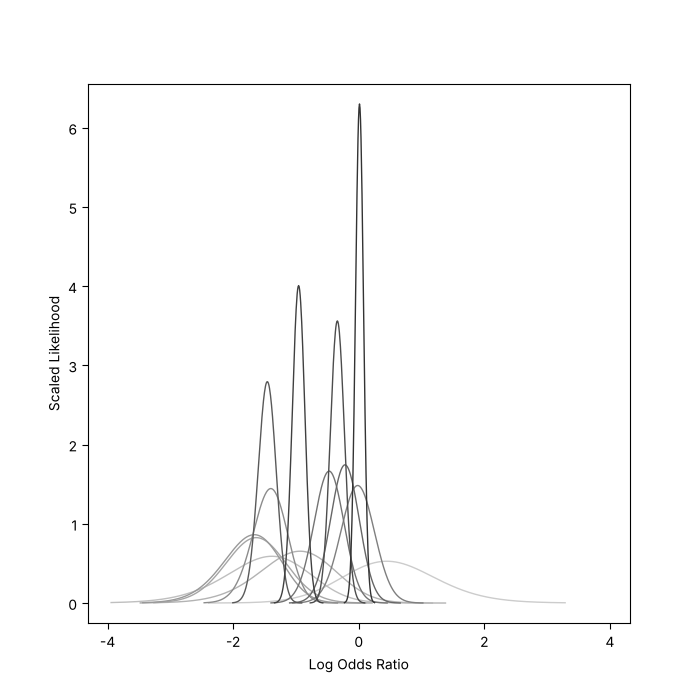
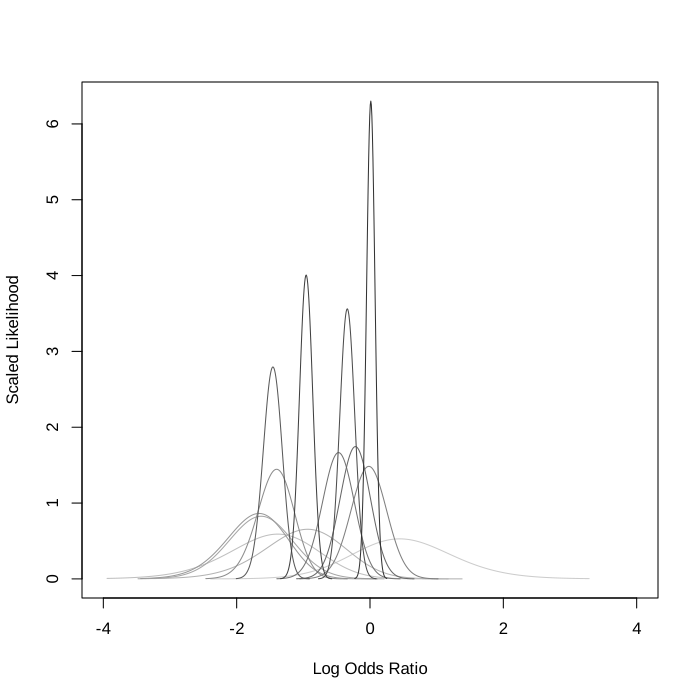
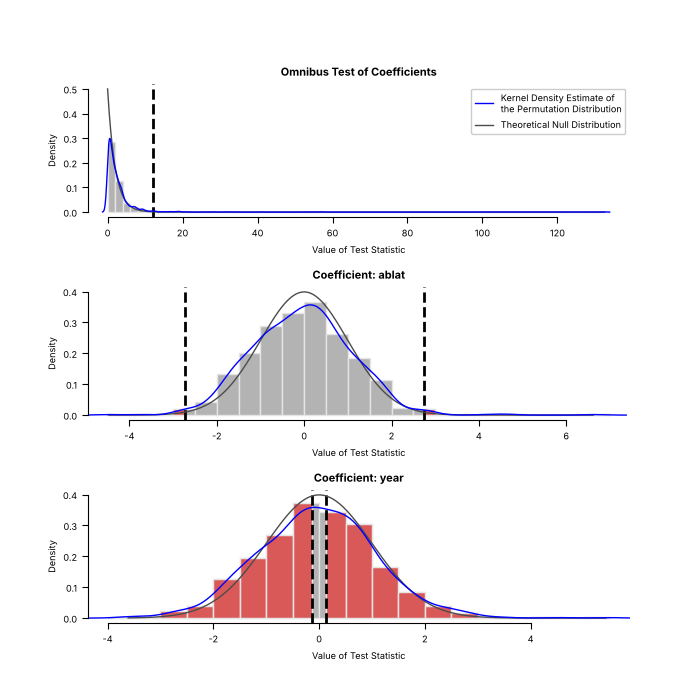
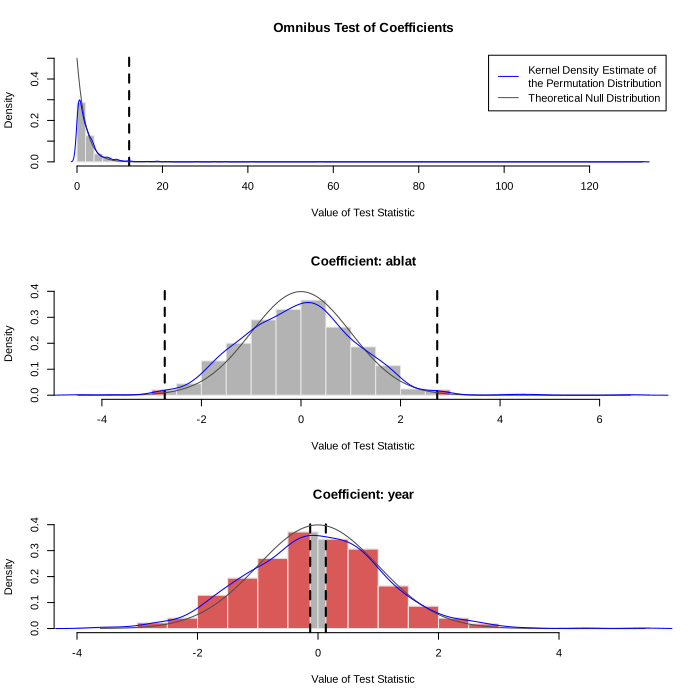
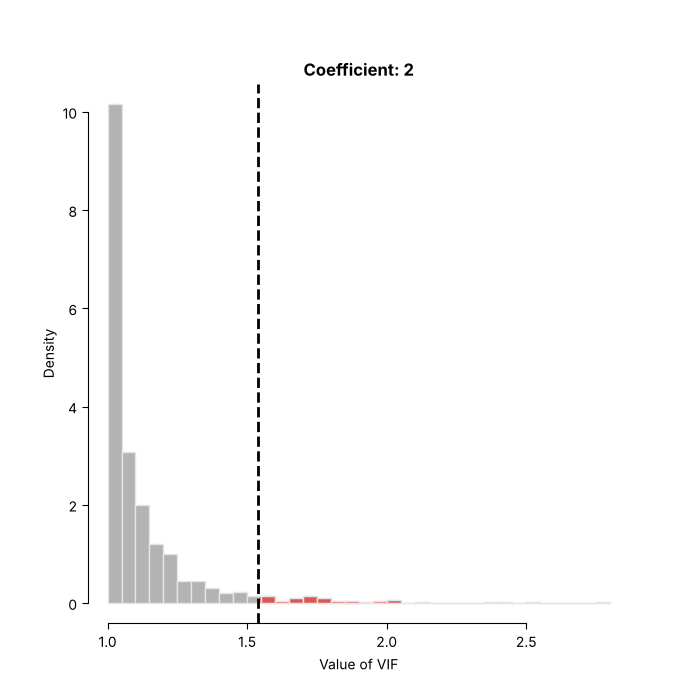
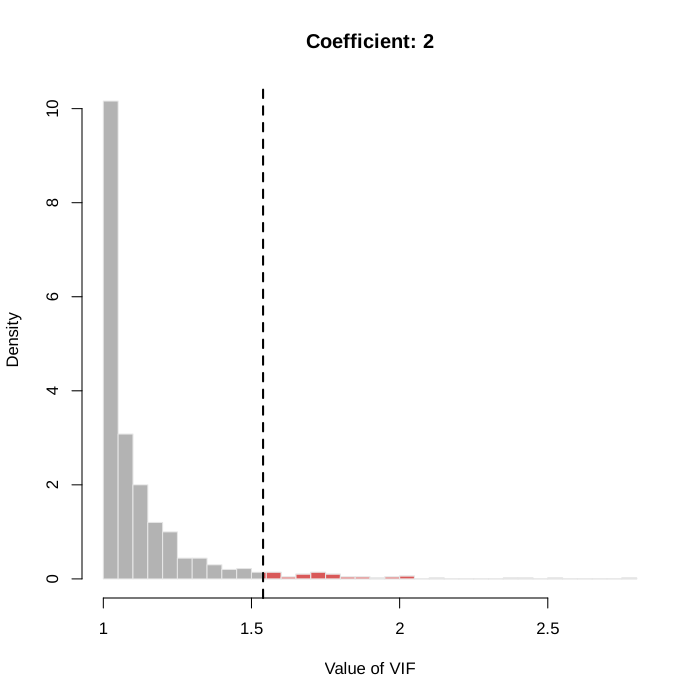
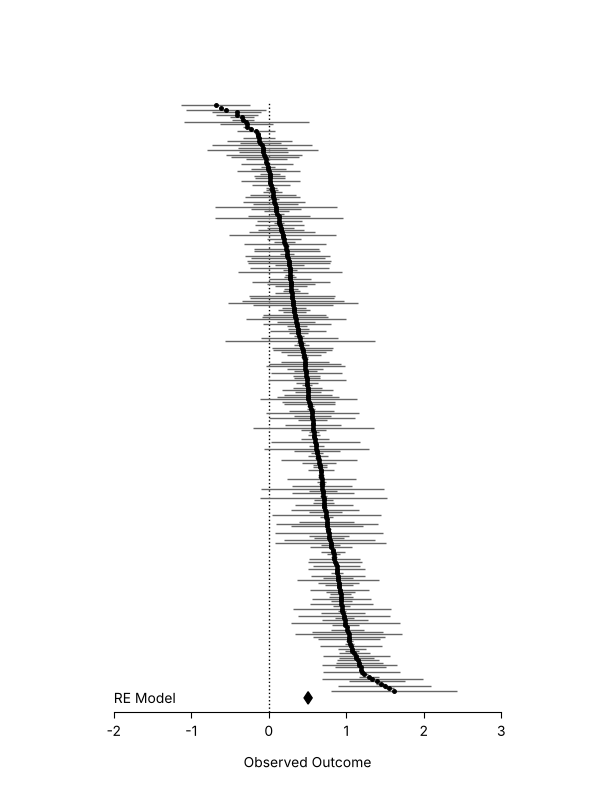
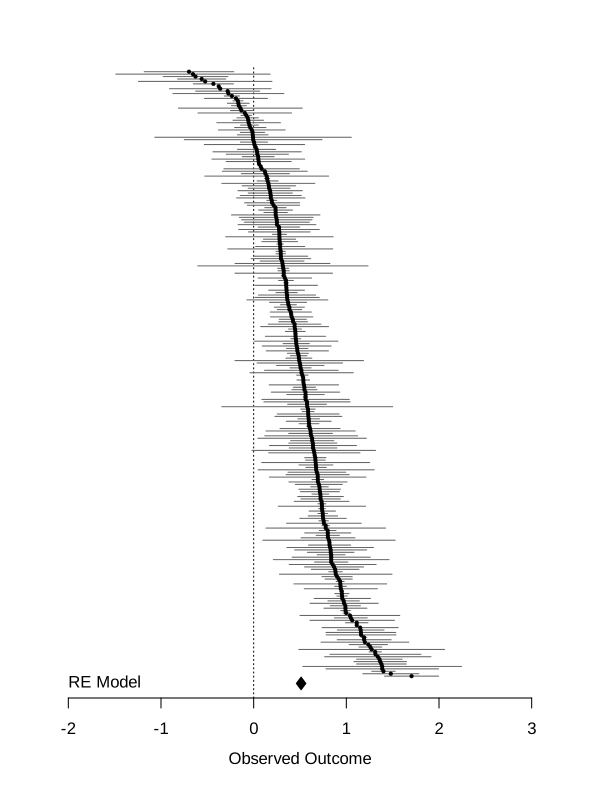
Every plot of the plot gallery drawn by metafopy and by R metafor 5.2-1 (side by side on wide screens), from the code of the corresponding page of the metafor plot gallery. The code of each figure is in the gallery; the link under each pair leads to it.
The two renderings agree in the geometry of what is drawn (positions, sizes, labels). They differ in details of the rendering such as the font, which is Helvetica or Arial in R and DejaVu Sans in matplotlib by default.
Forest plot with extra annotations
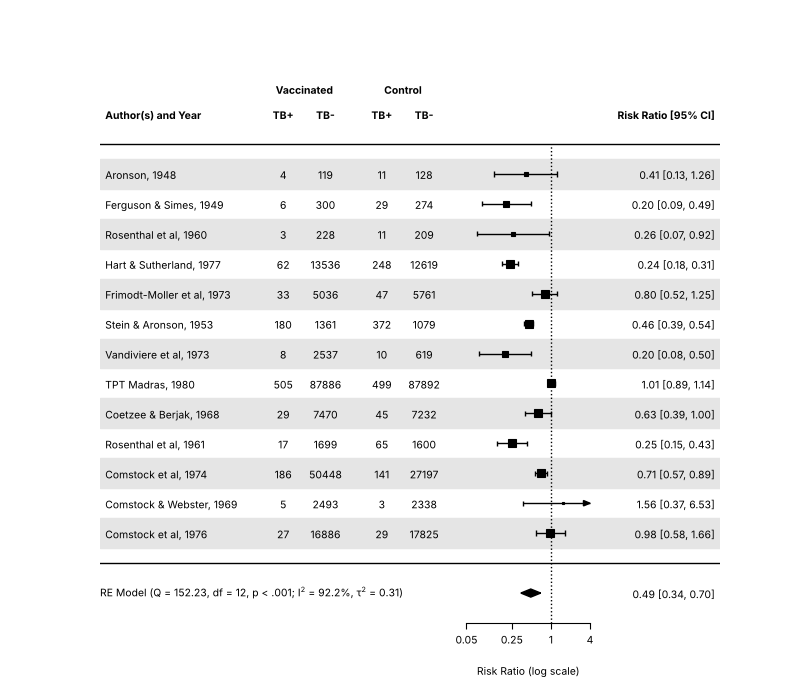
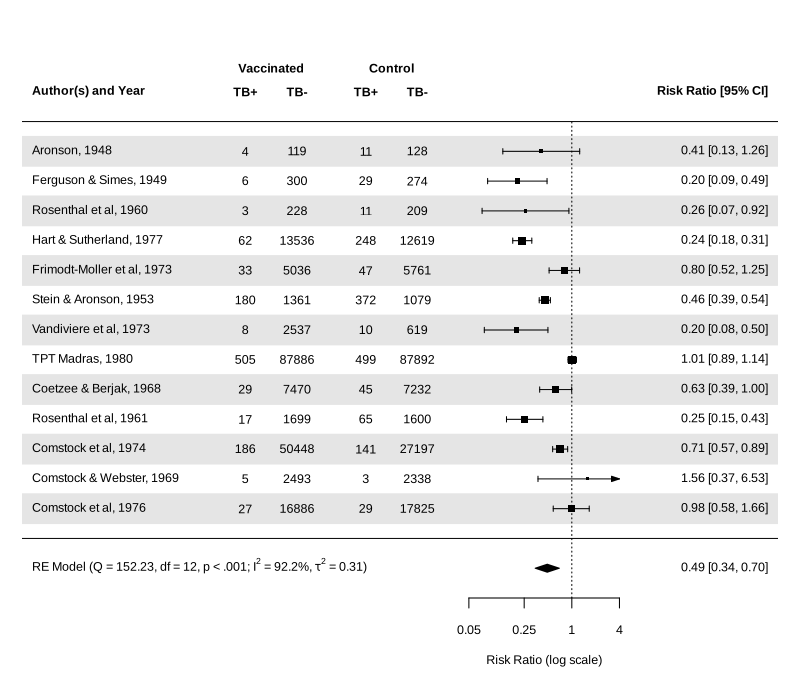
Forest plot with adjusted text position
Forest plot with subgroups
Forest plot with multiple CIs
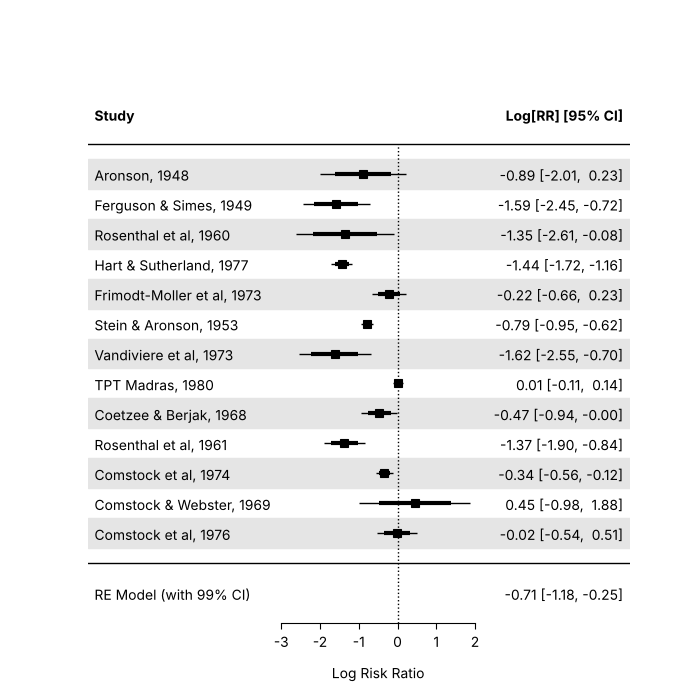
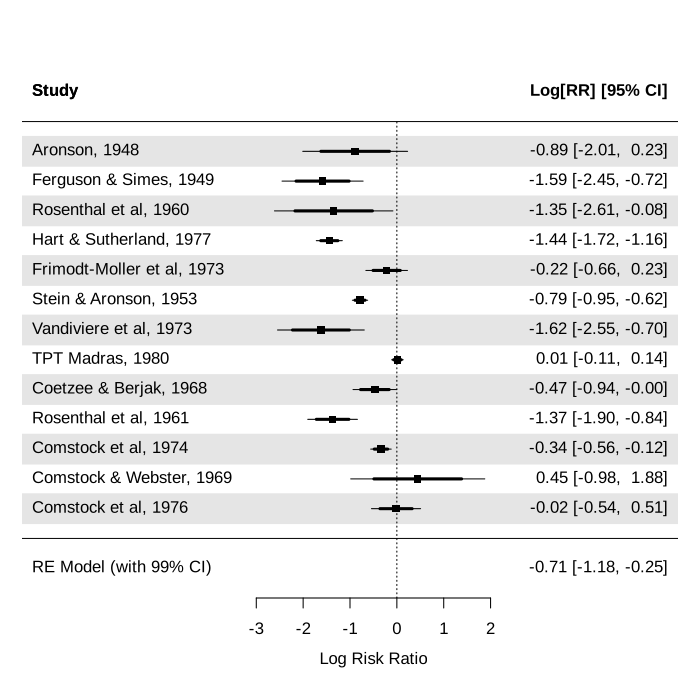
Forest plot with superscripts
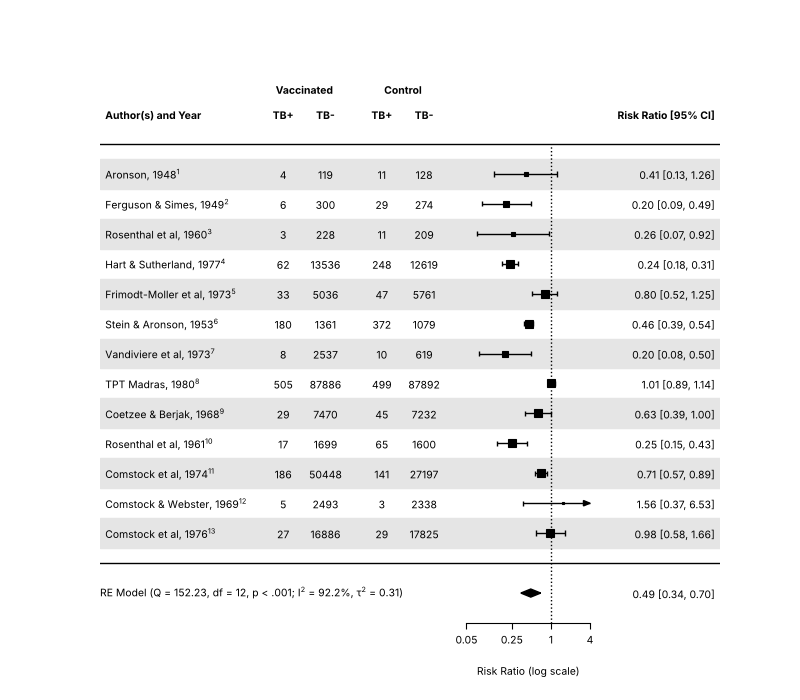
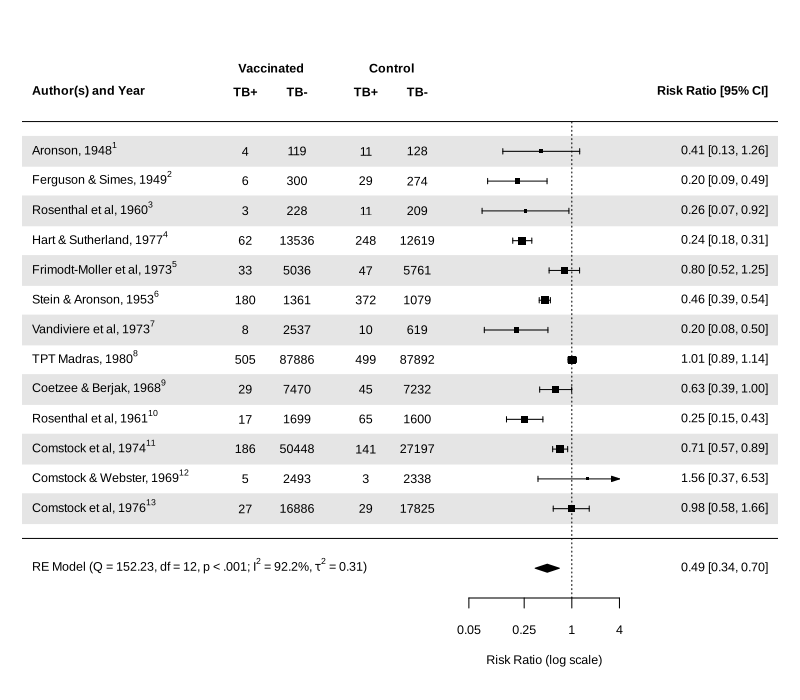
Forest plot in RevMan style
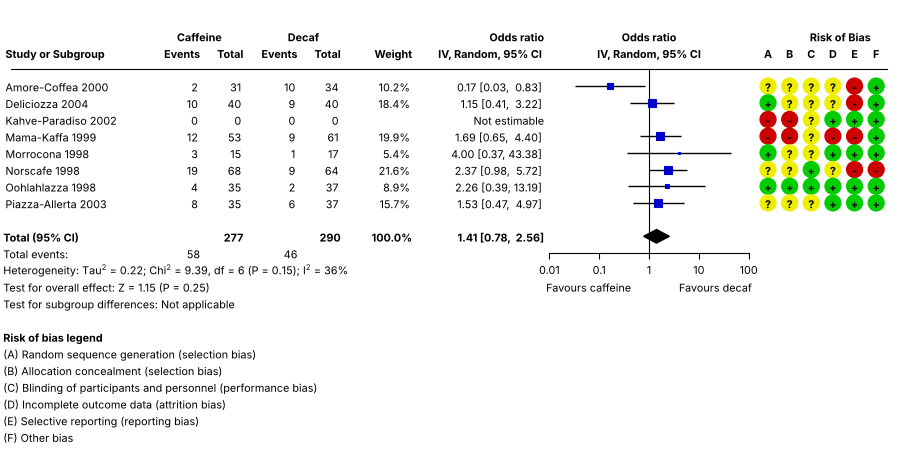
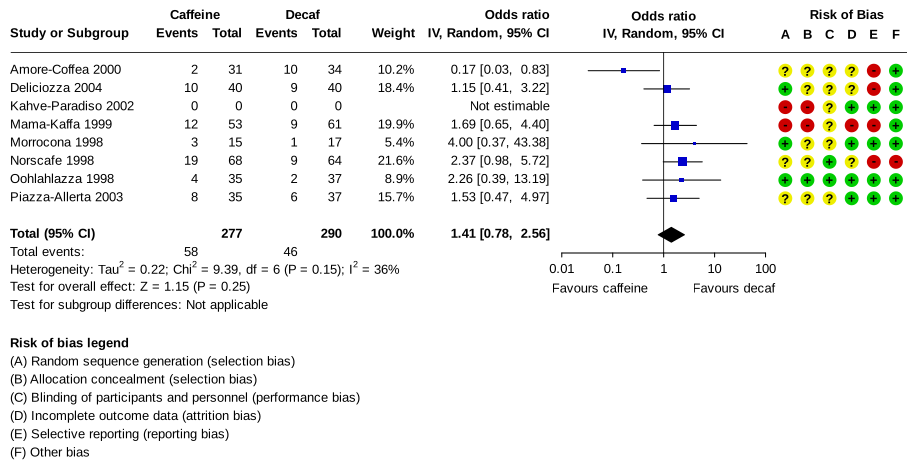
Forest plot in BMJ style
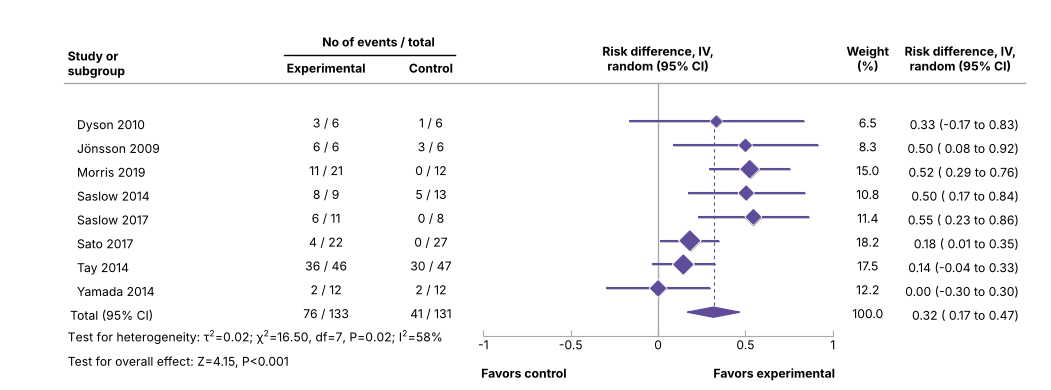
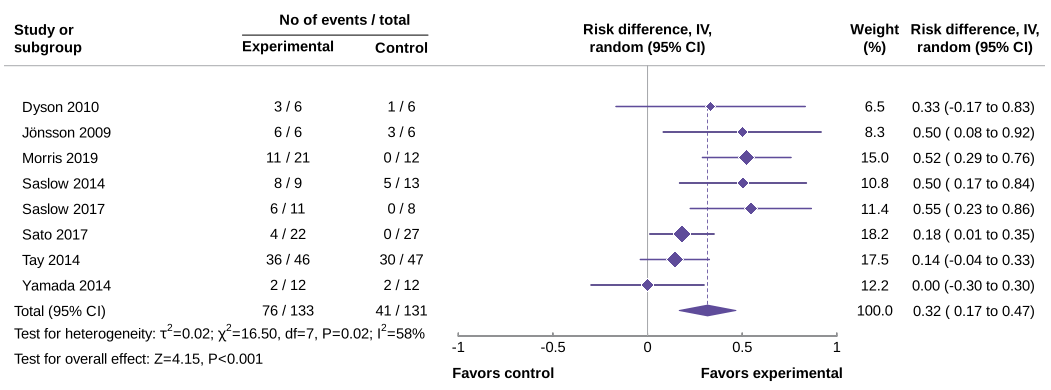
Cumulative forest plot
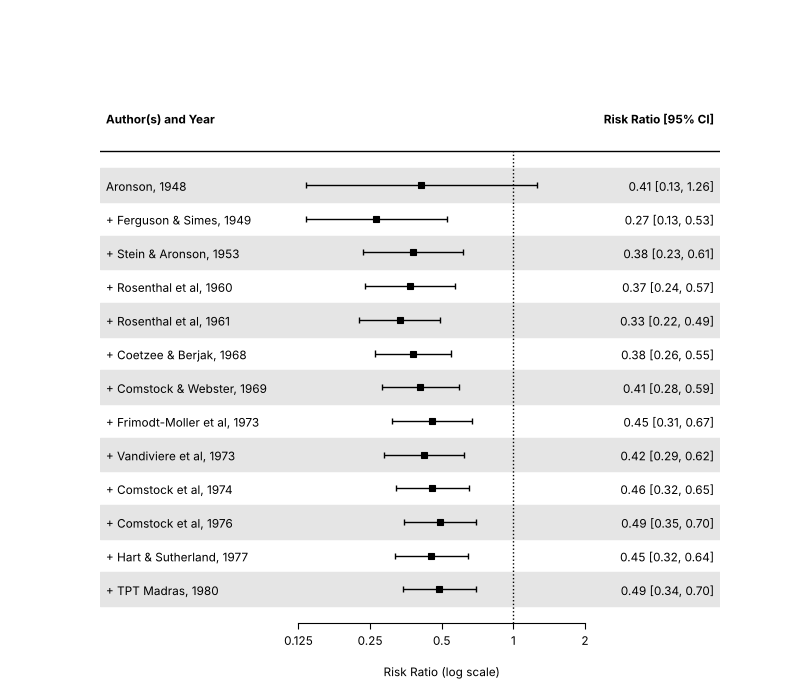
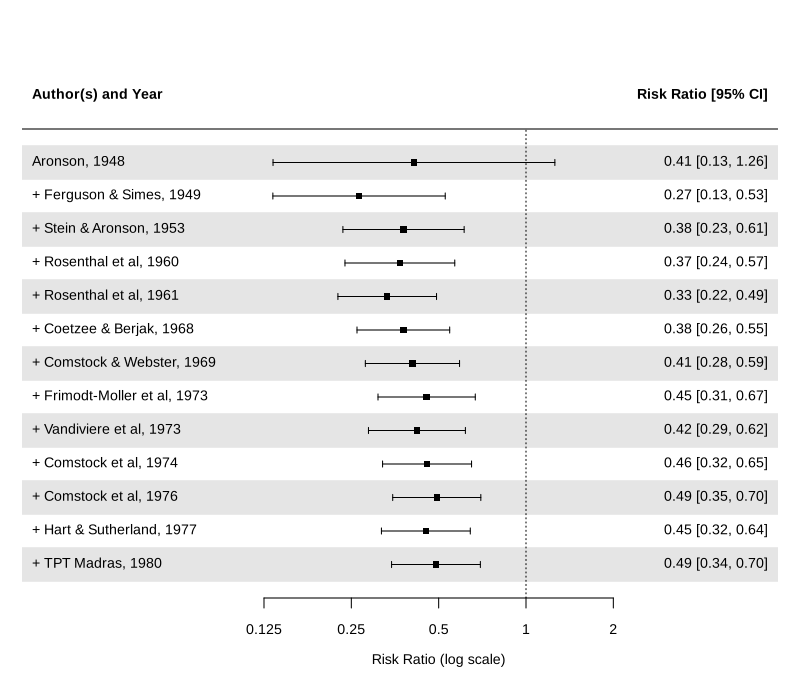
Meta-analytic scatterplot
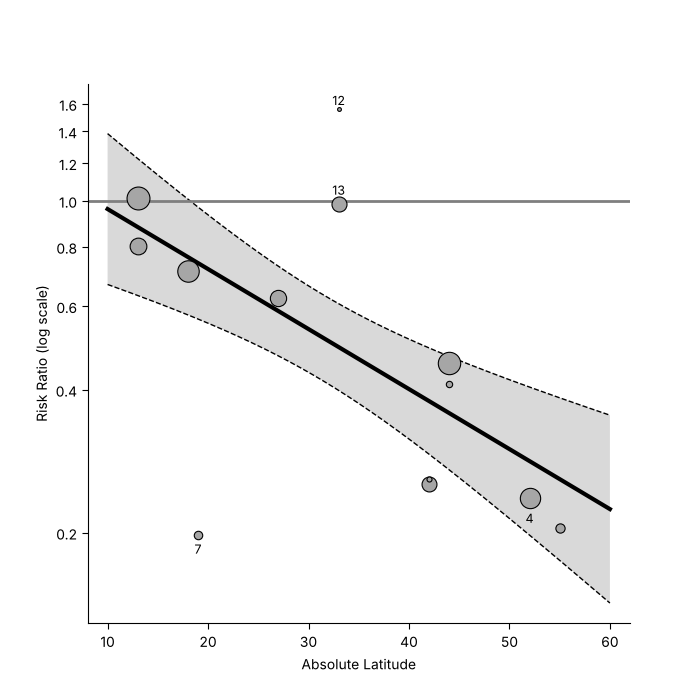
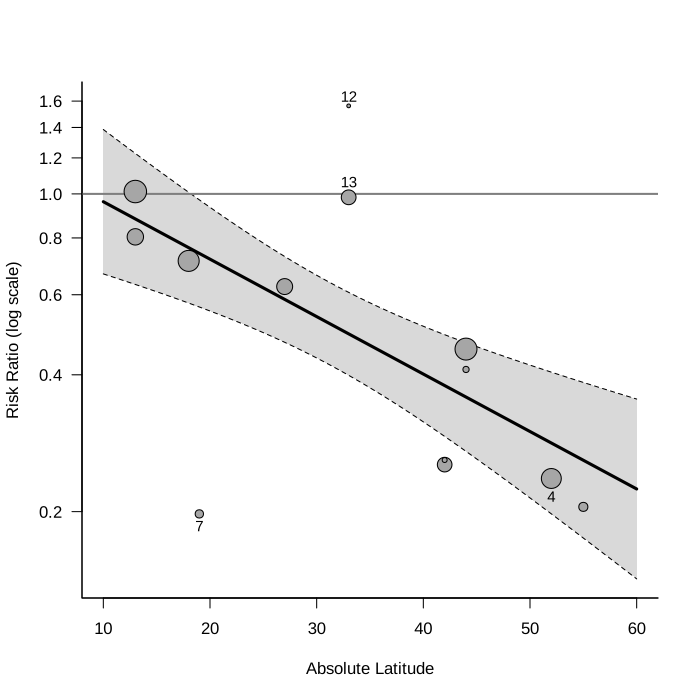
Funnel plot variations
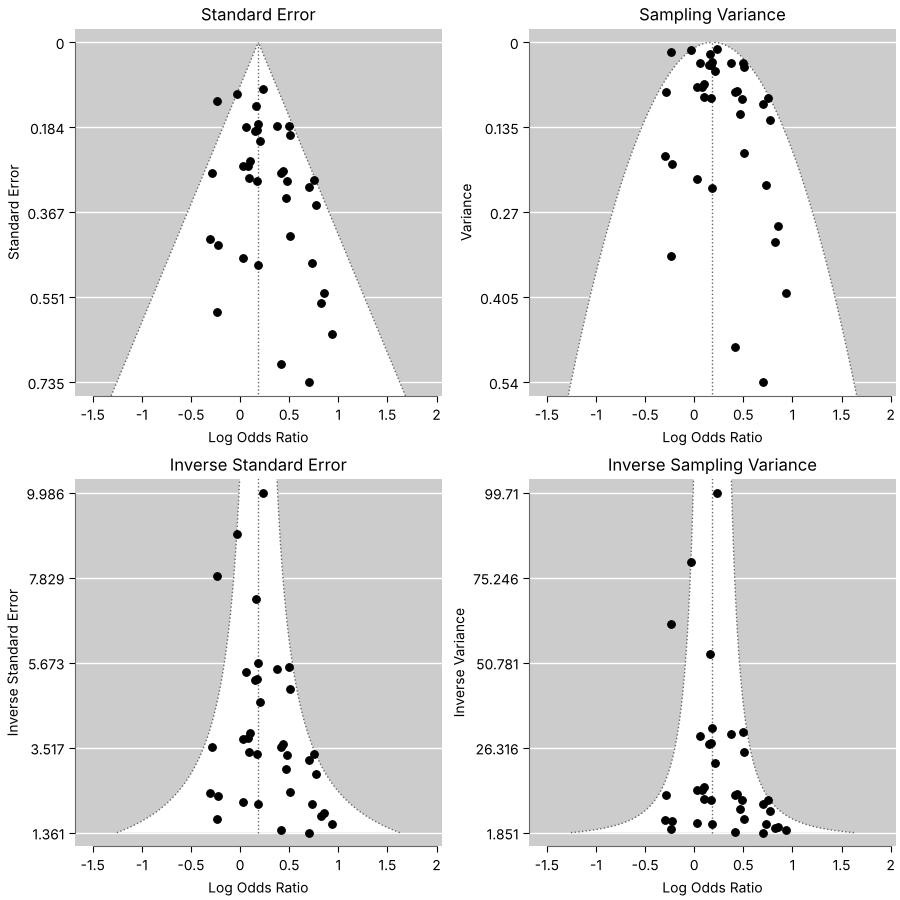
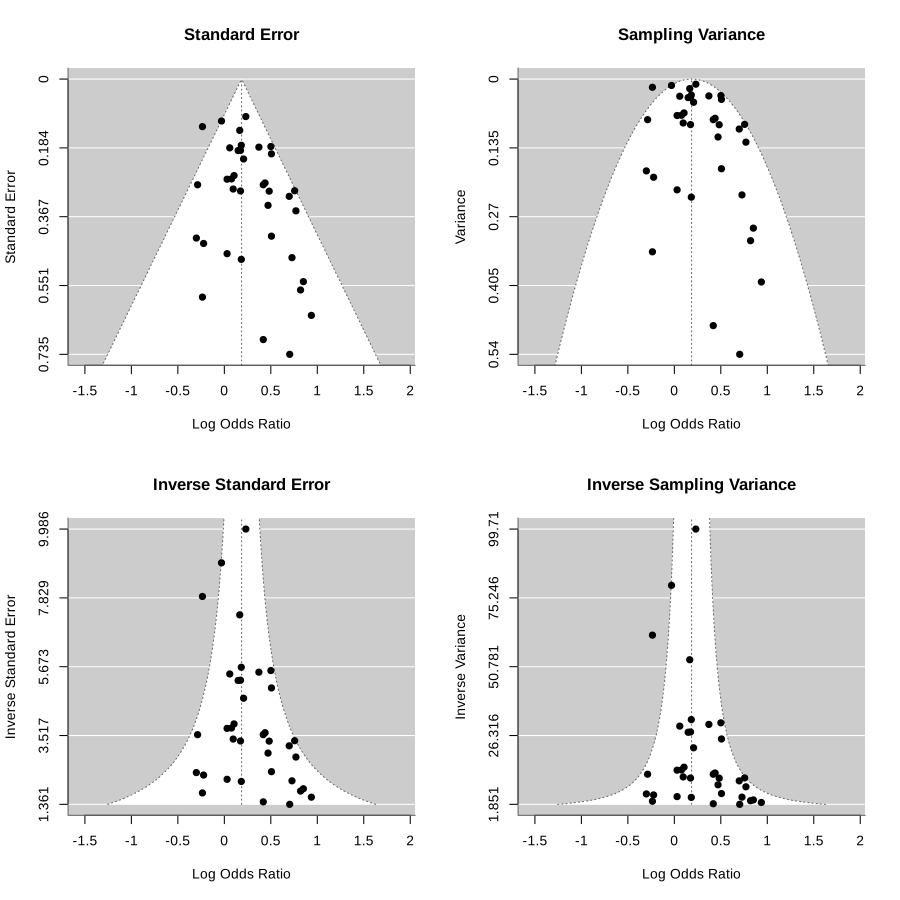
Contour-enhanced funnel plot
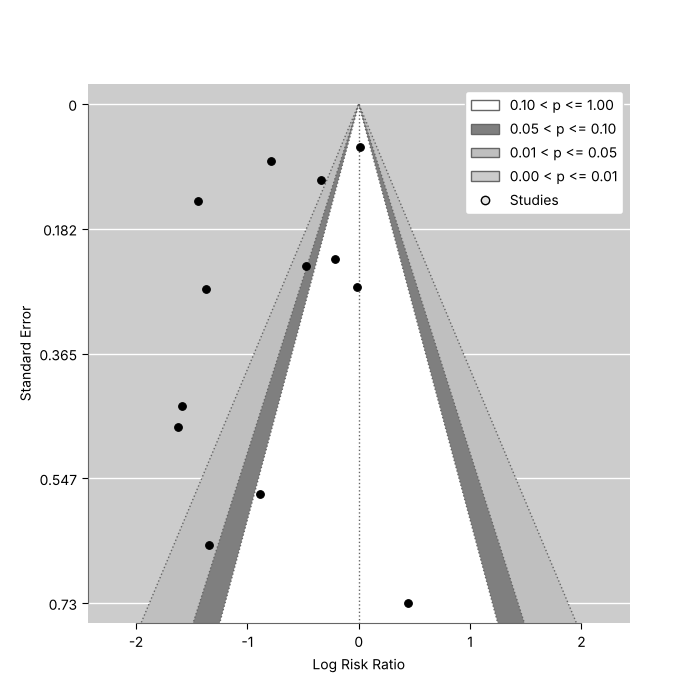
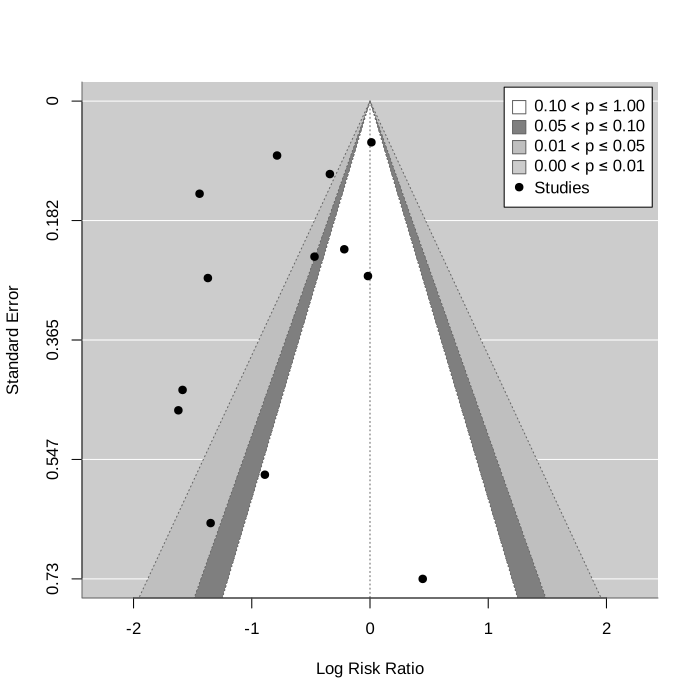
Contour-enhanced funnel plot with the precision on the vertical axis
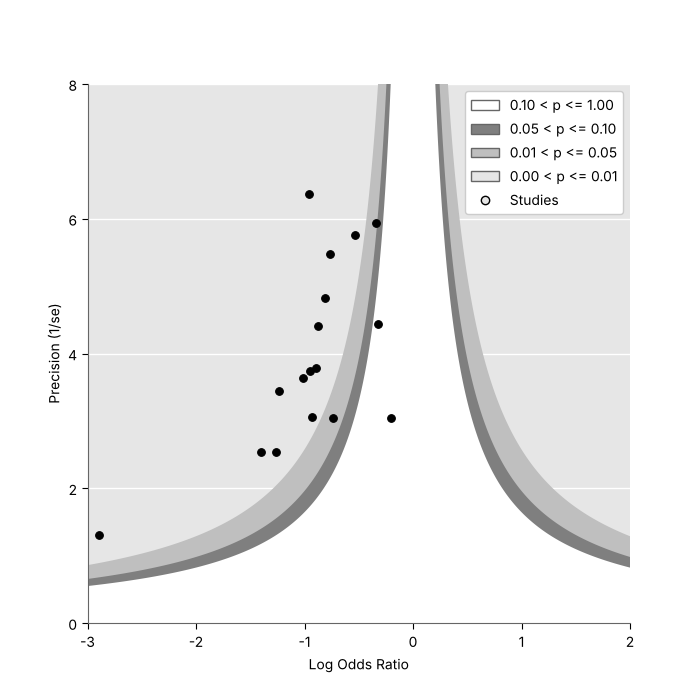
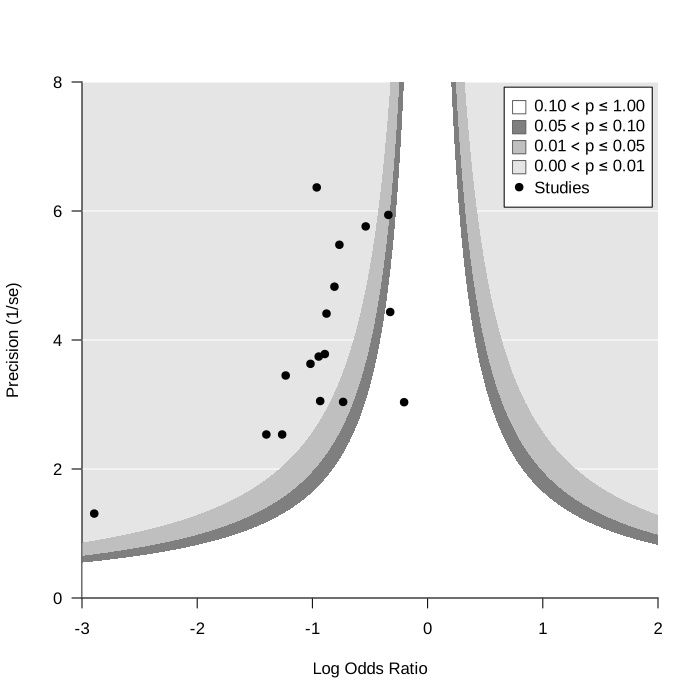
Funnel plot with limit estimate
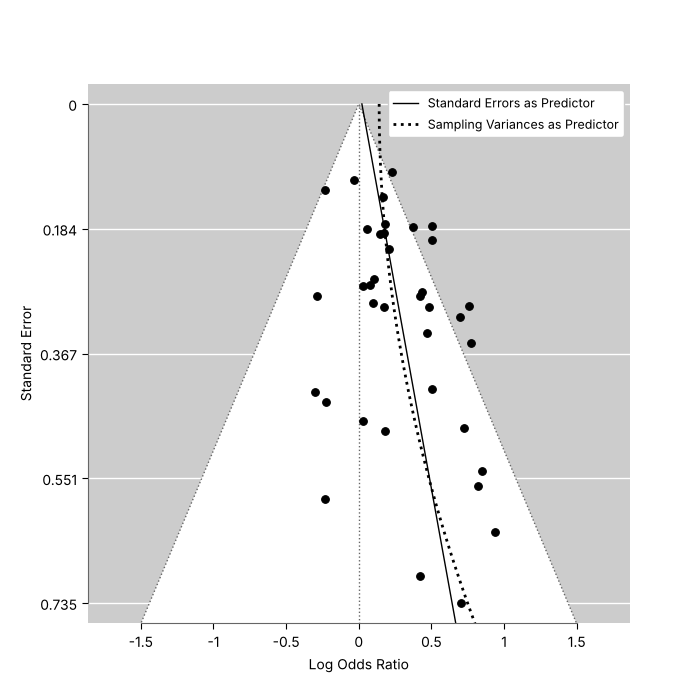
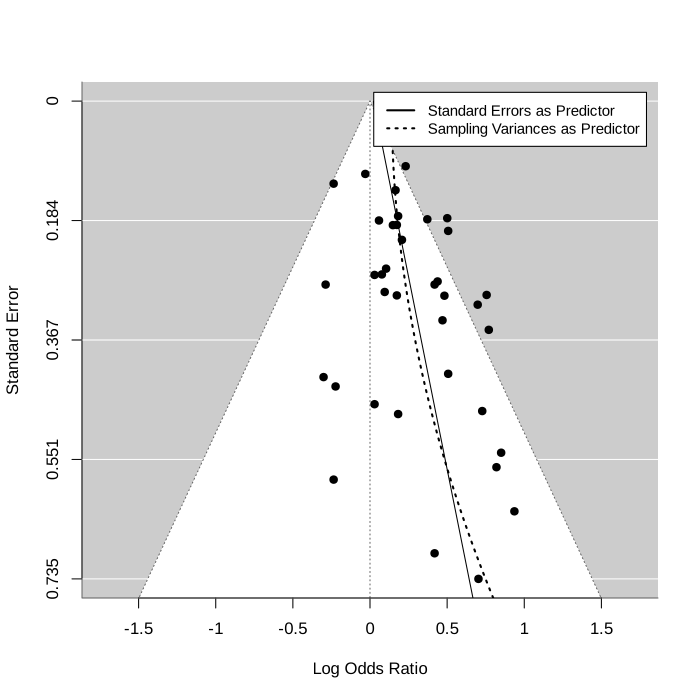
Funnel plot with trim and fill
Radial plot
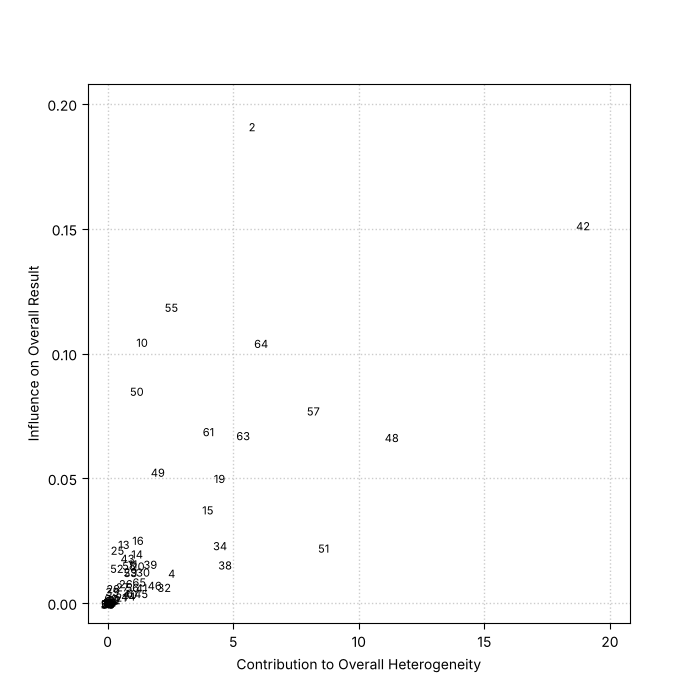
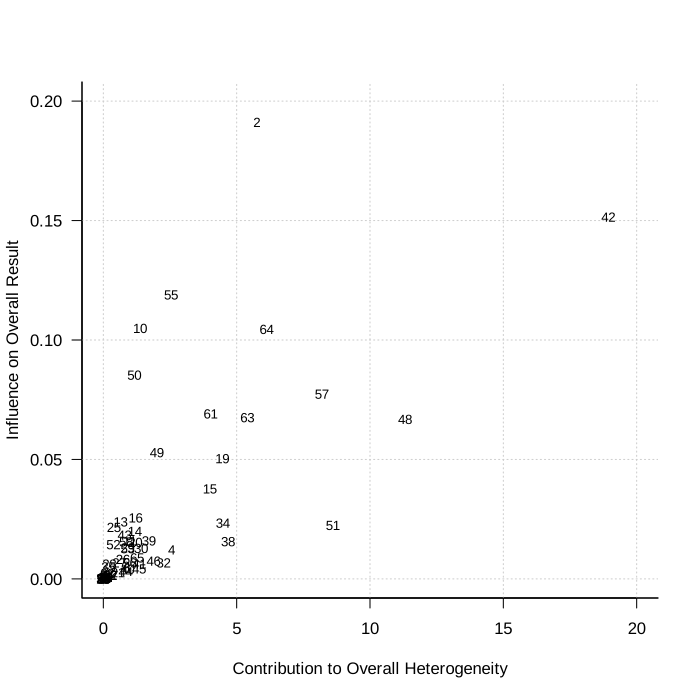
Baujat plot
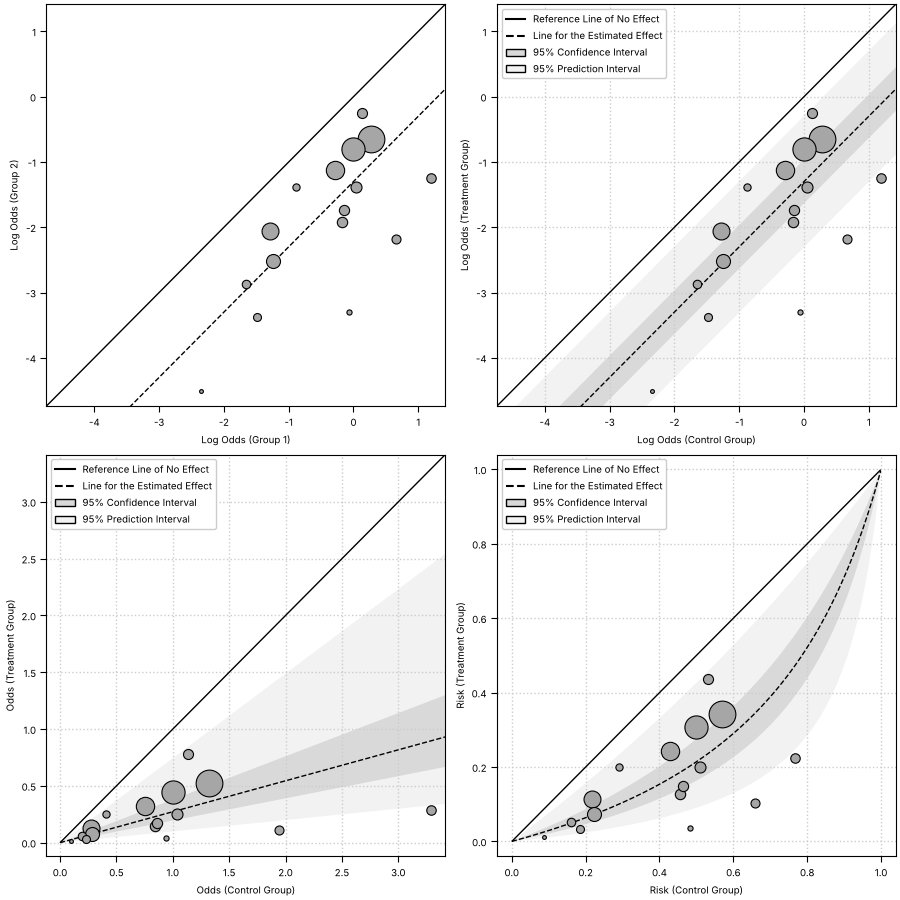
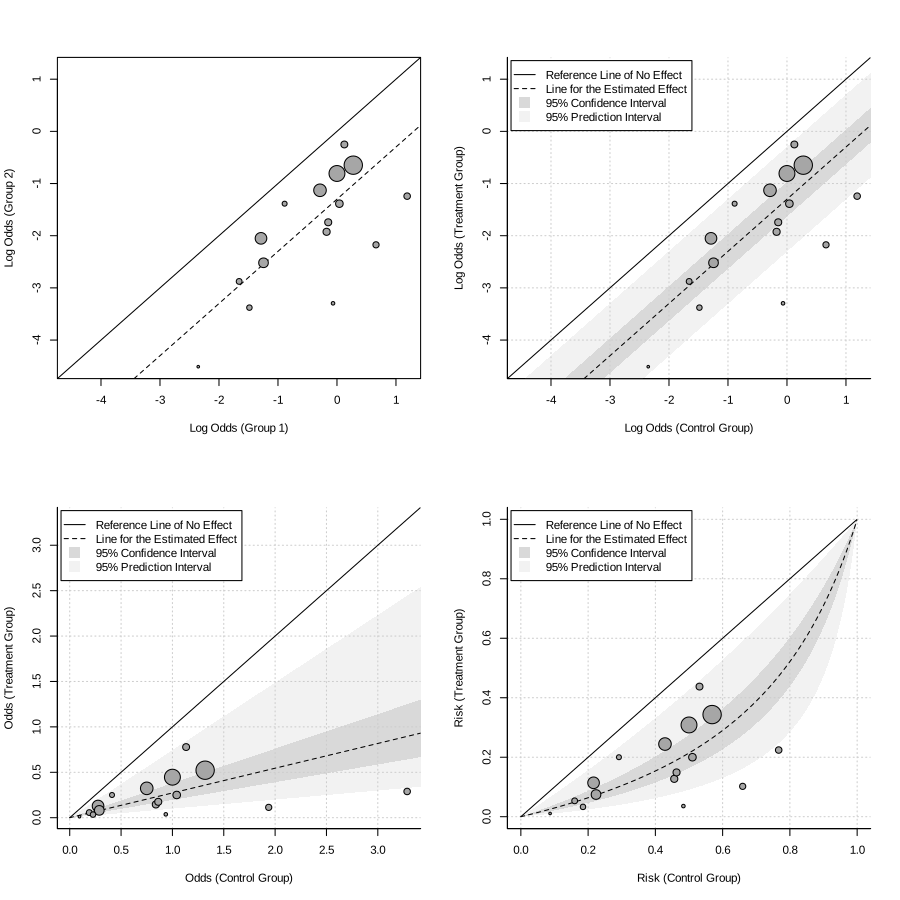
L'Abbe plots
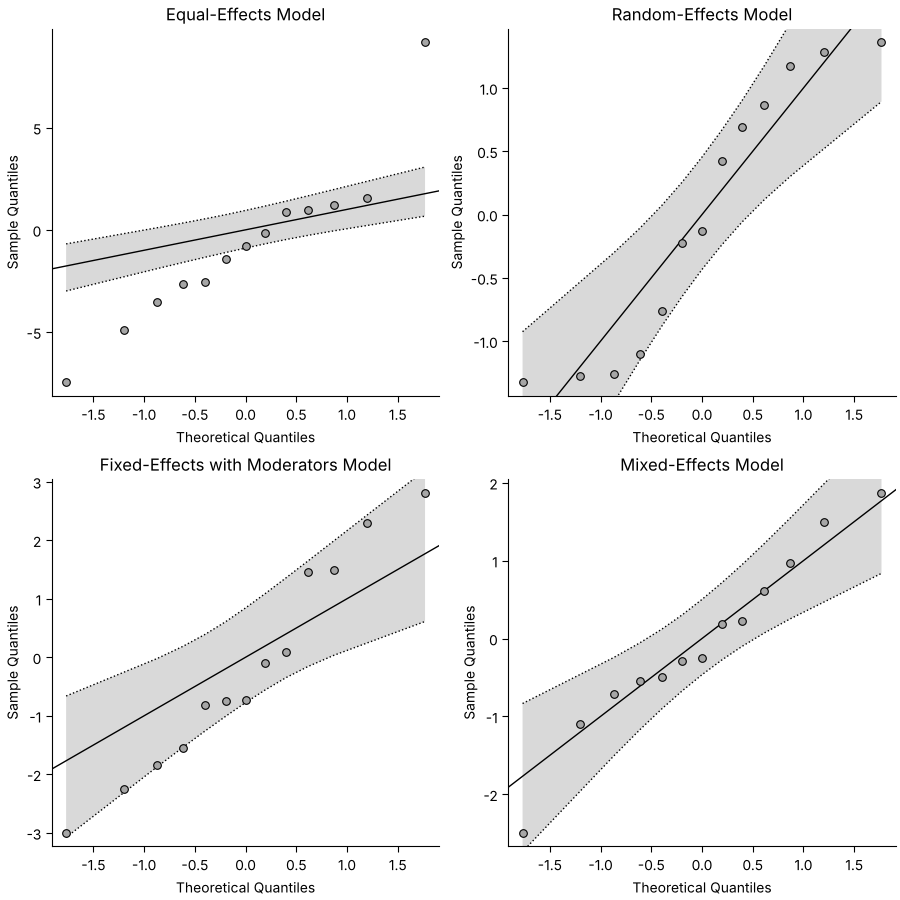
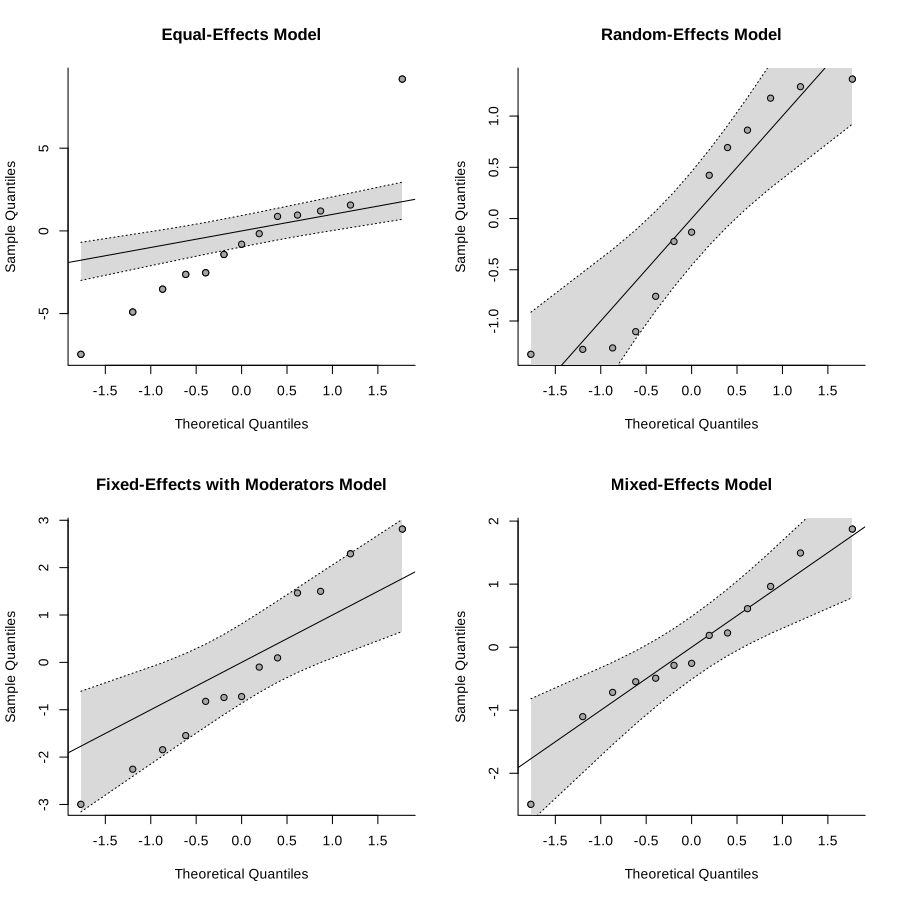
Normal quantile-quantile plots
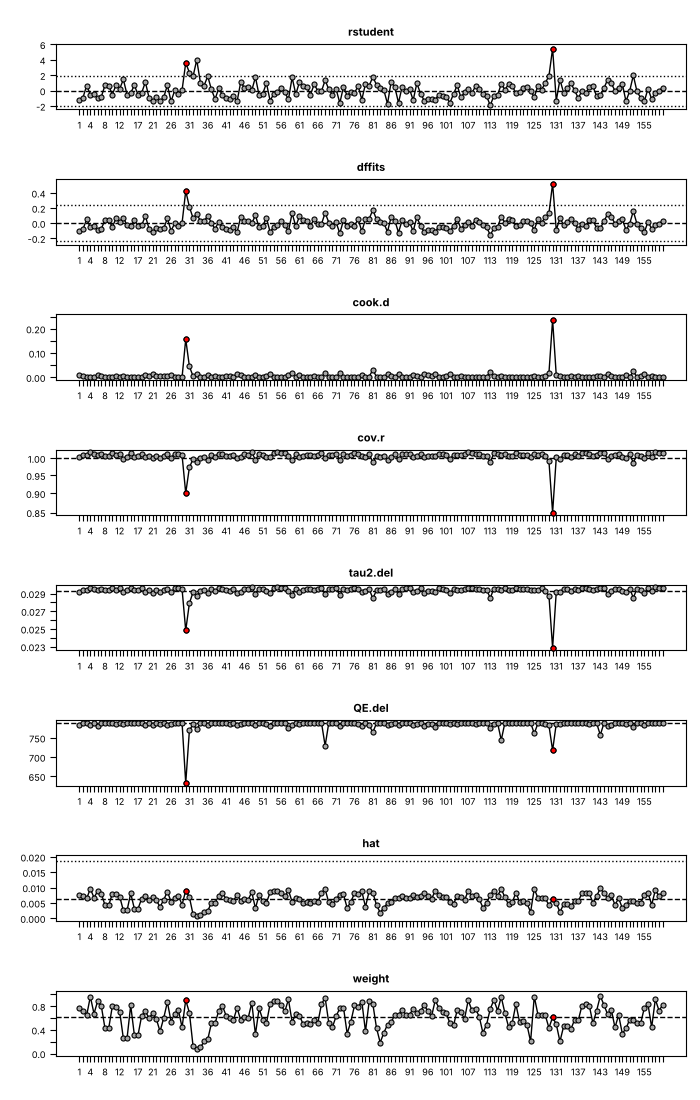
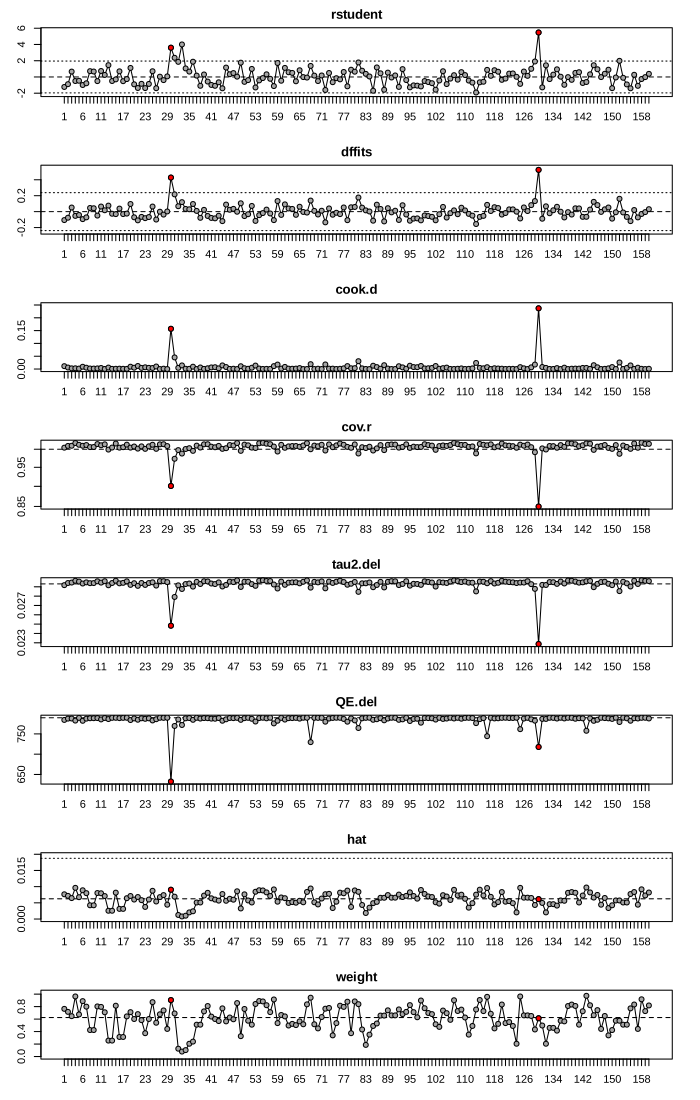
Plot of influence diagnostics
GOSH plot
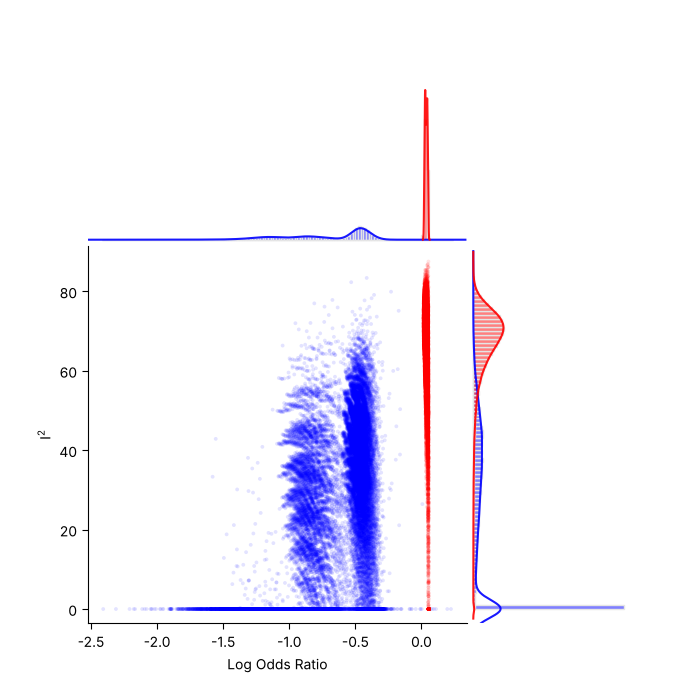
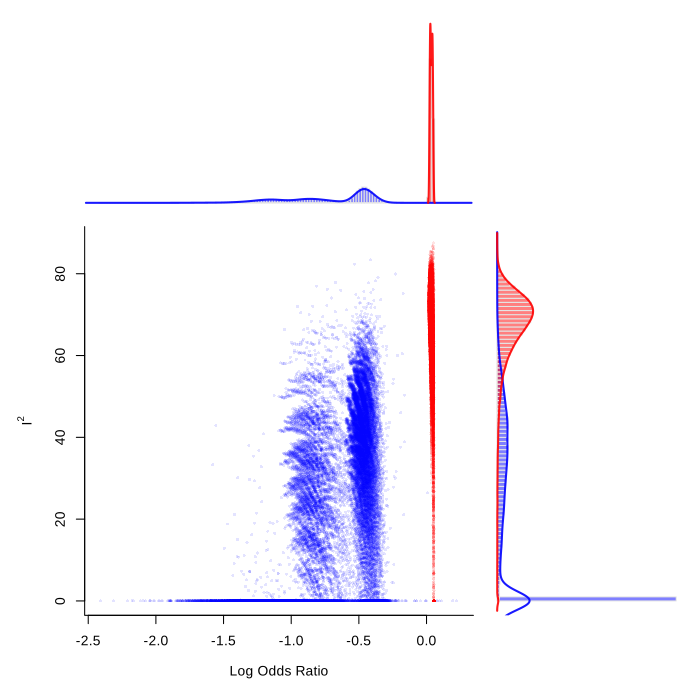
Plot of cumulative results
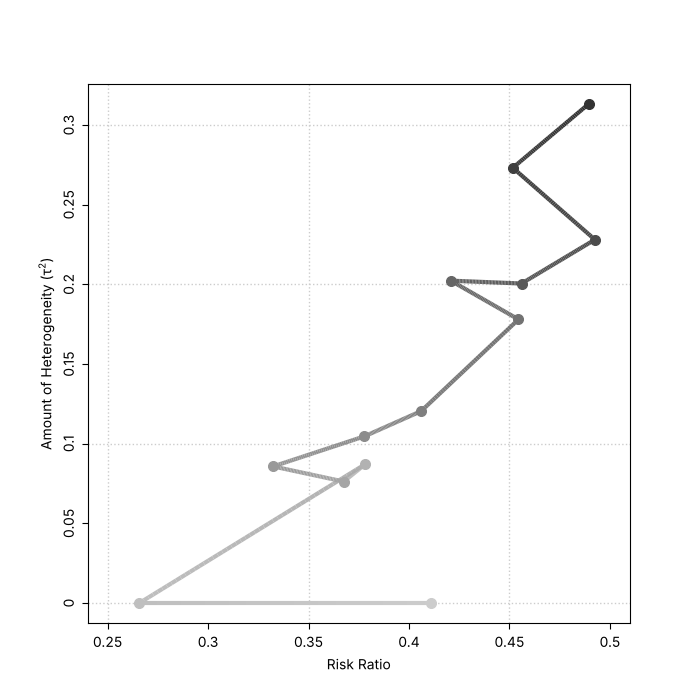
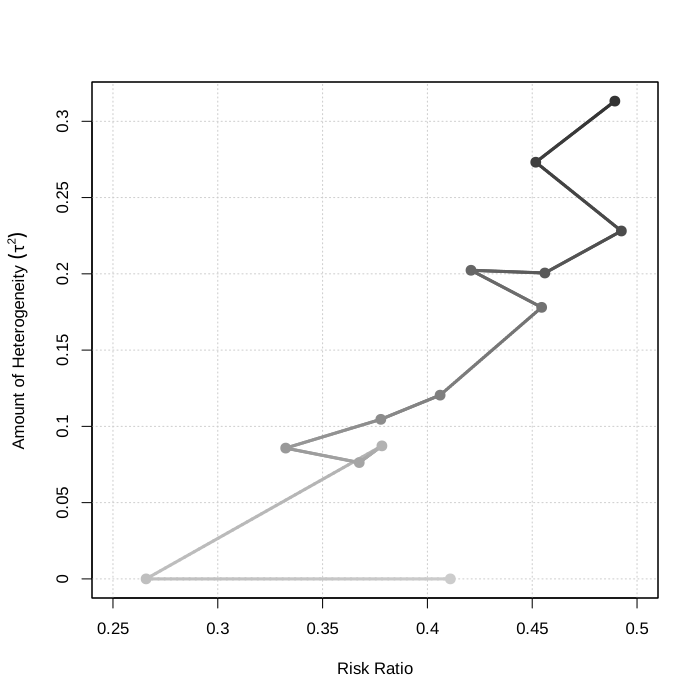
Log-likelihood plot
Permutation distributions
Simulated variance inflation factors
Caterpillar plot
Forest plot with grouped estimates
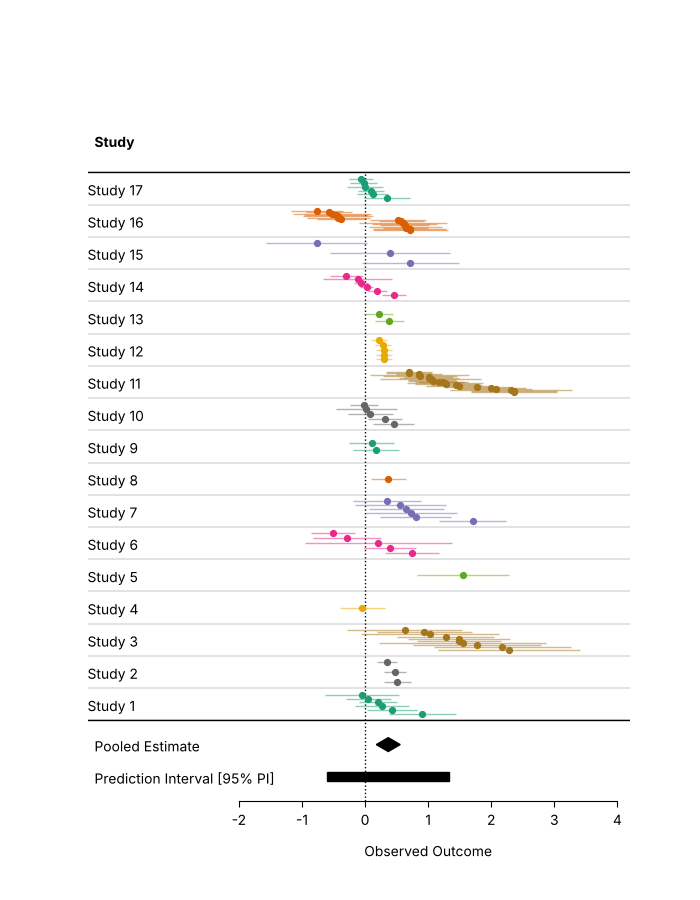
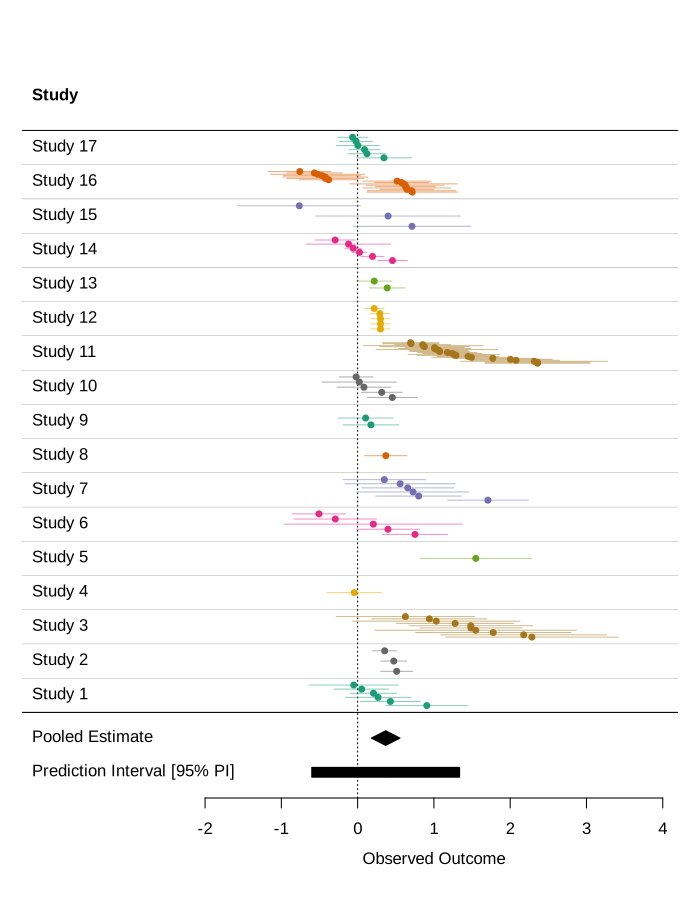
Forest plot in orchard style